Ira F. Jersey and Will Hoffman
Bloomberg Intelligence
September 20, 2024
The Federal Reserve’s downward shift in the dot-plot from the summary of economic projections has been fully priced by the market, but we think this outcome is less likely than an early end to cuts, or deeper cuts than are priced. The 2-year/10-year yield curve is priced to steepen another 40 bps by this time next year, but this may not be enough.
Visit BI RATEN <GO> for research and key data. To subscribe, click the button above. (09/20/24)
Dot Plot vs. December SOFR Futures
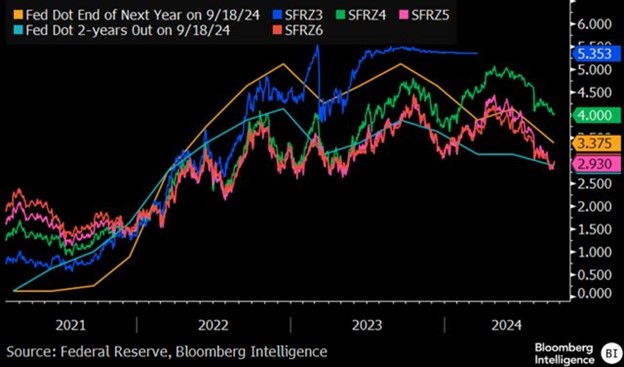
The rate market is broadly priced for the Fed’s dot plot to be realized, with December 2025 SOFR futures priced for sub-3% short-term interest rates by early 2026. This squares with the Fed easing at its January 2026 meeting after cutting rates another 1.5% by the end of next year. To generate alpha against what’s priced, investors would need to have a view on which path the economy and inflation — and therefore rate policy — will take, and then bet against current market pricing. (09/20/24)
Three Potential Paths for Fed’s Policy Rate

There are many potential paths for Fed’s rate cuts, including several historical precedents. Beginning in mid-1995, the Fed cut by 75-bps over six months, then stopped, an outcome we don’t expect. We think there’s more policy momentum this cycle, allowing for more cuts, barring a prompt re-acceleration in economic growth and inflation. The Fed’s actions and communications suggest its expectations are toward a less-tight policy to maintain economic growth. We see three realistic outcomes, with the Fed’s dots as the least likely among them.
It’s possible the Fed becomes comfortable with a seemingly sustainable but lower level of economic activity, meaning it cuts at every meeting until rates reach 4% before pausing, implying a soft landing. If the economy declines more rapidly (our base case), cuts down to 2% are possible. (09/20/24)
R* Models and Real Yields
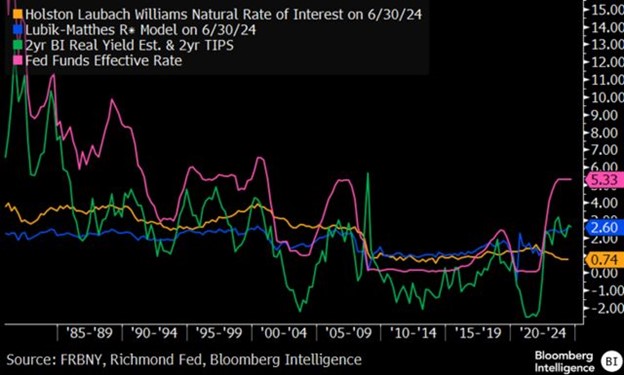
The Fed has several different models for the real neutral rate at its disposal. We suspect some of these inform why some members of the FOMC position their fed funds expectations in the quarterly dot plot. For example, the Richmond Fed produces the Lubik-Matthes model, which suggests the natural rate should be 2.6%, implying the fed funds rate is very restrictive.
Another model of the natural real fed funds rate produced by the New York Fed, the Holston Laubach Williams model, suggests the real fed funds rate should now be 0.74%. It’s currently 2.33%, based on effective fed funds and the year-over-year PCE deflator. (09/20/24)
1y1y OIS vs. 1y1y CPI Swaps
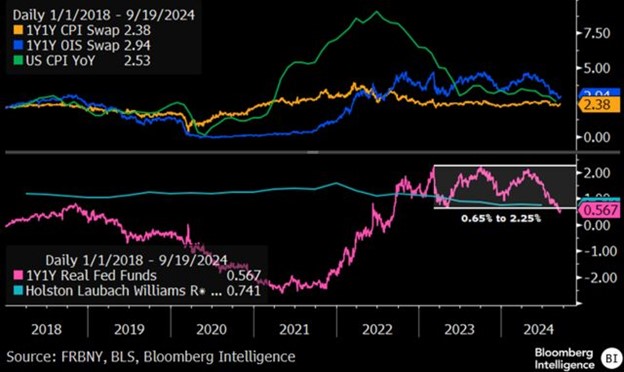
The market is pricing for the Fed to cut rates until it reaches the Holston Laubach Williams modeled neutral rate. Given where 1-year forwards for 1-year CPI swaps and fed funds OIS are, the market is pricing the real funds rate to be about 54-bps this time next year. Adding an adjustment for the difference of CPI and the PCE deflator by autumn 2025 Fed policy should be neutral, according to their policy, if not somewhat accommodative.
This is the way we think some at the Fed view policy. Of course, the path could shift meaningfully, and we suspect this scenario is less likely than either better and worse trajectories for the economy and inflation. (09/20/24)
1-Year Forward Yield Curves vs. 1-Year Forward Yield
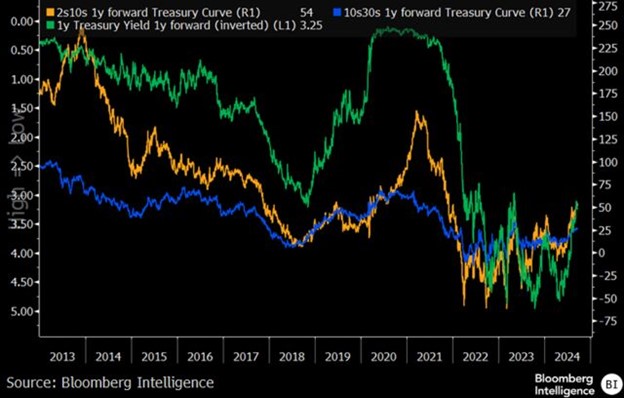
One-year implied forwards on the 2-year/10-year and 5-year/30-year Treasury yield curve appear to be fully priced for the expected Fed dots. This isn’t a surprise, but we think there is a risk that the yield curves steepen more than what is priced. The 2-year/10-year curve is priced to steepen to 54-bps in a year’s time, which we think may be too low. The 10-year Treasury yield may not move much, even as the Fed continues cutting rates, while the front end of the curve will follow the Fed rate path. (09/20/24)